
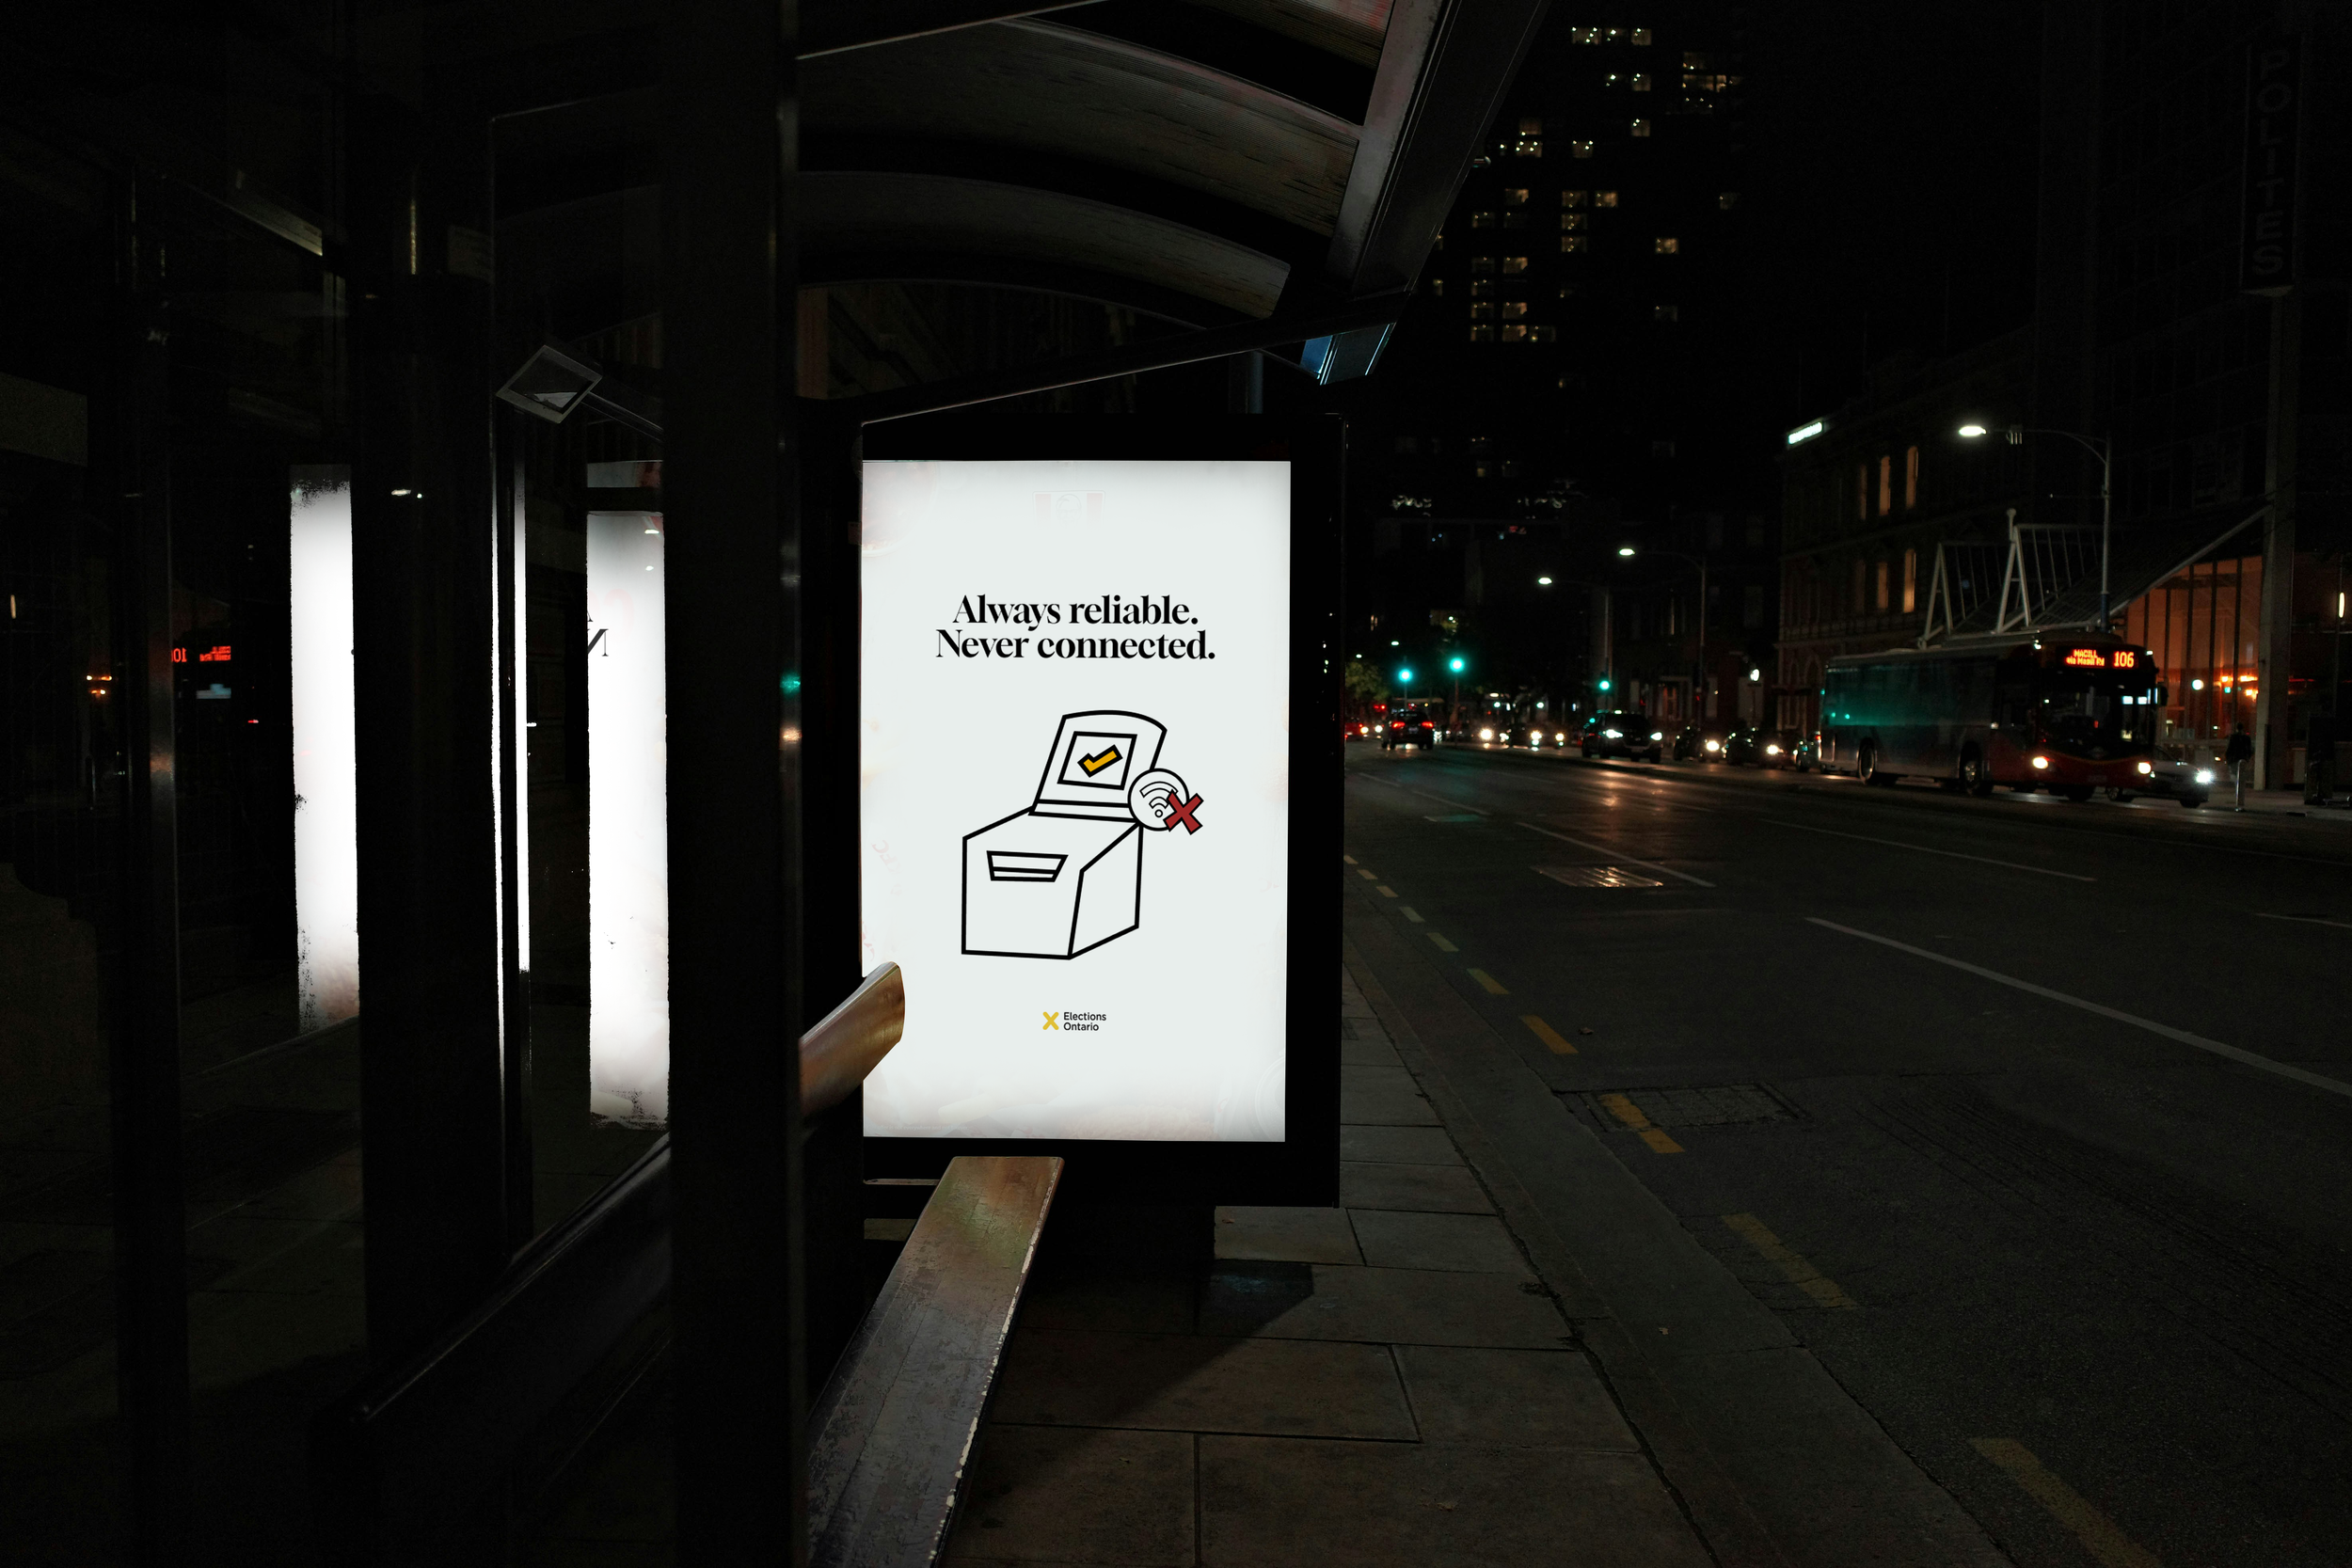
Co-Creating an Internal Tool for Survey Data Access within an EMB.
The Insights Explorer.
THE PROJECT:
Elections Ontario’s research and insights team produces a wealth of survey data after every general election. But findings from the 2025 surveys were difficult to access and hard to navigate across teams. Insights went unused, or were understood differently depending on who was reading them.
The research format was also out of step with how staff wanted to receive information. Reports were built to be read start to finish, while staff were often searching for one specific number or trying to explore a question.
This project aimed to discover how we might empower all EO staff to confidently access and use survey data, building data literacy and evidence-based decision making across the organization.
THE OPPORTUNITY:
Working alongside a fellow researcher from the Research & Insights team, the goal was to build an internal tool that improves access to current and historical survey data, presents it in a visually engaging way, and supports comparison across datasets and time periods.
Rather than jumping to a solution, we started with a discovery phase to understand who we were designing for, what prompts staff to look for survey data, and what successful data use looks like.
Through horizon scanning of analogous dashboards, a Learning Lab workshop with staff from five teams, and interviews with Corporate Affairs and HR managers, we were able to see how teams currently interact with research. Using collaborative affinity mapping, we synthesized patterns into a journey map, two use cases, four opportunity areas, and a set of design principles to guide prototyping.
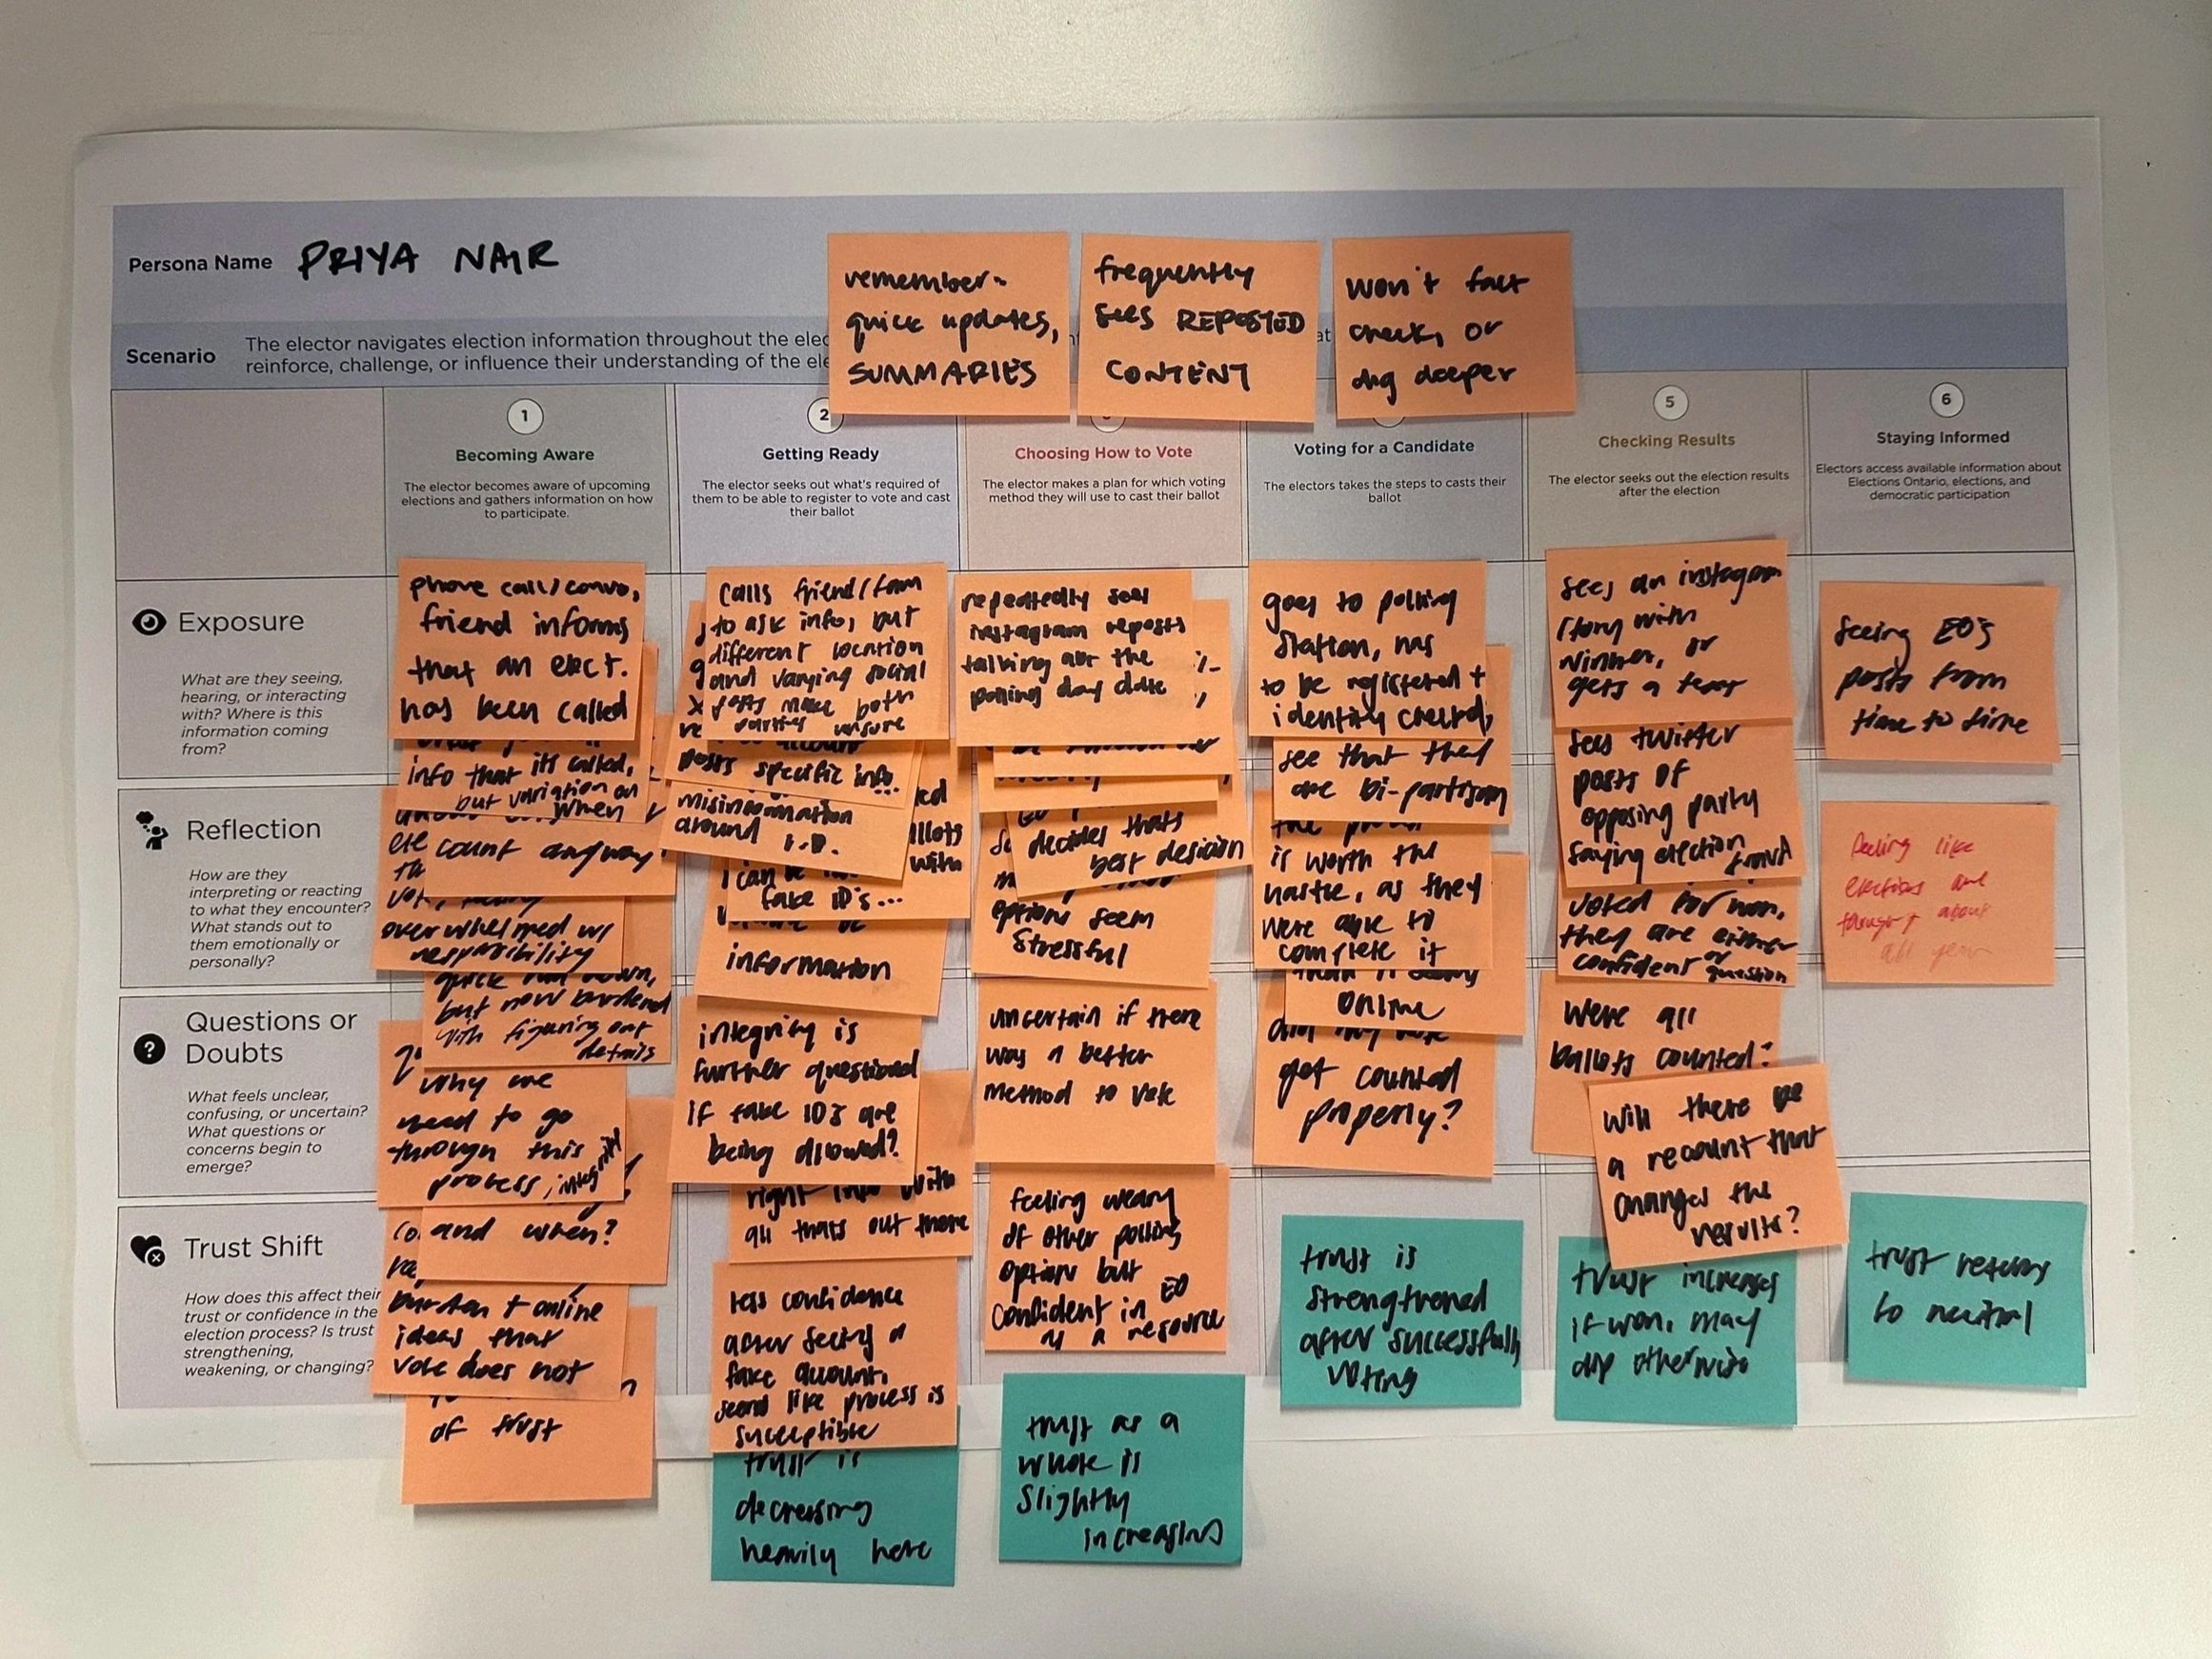
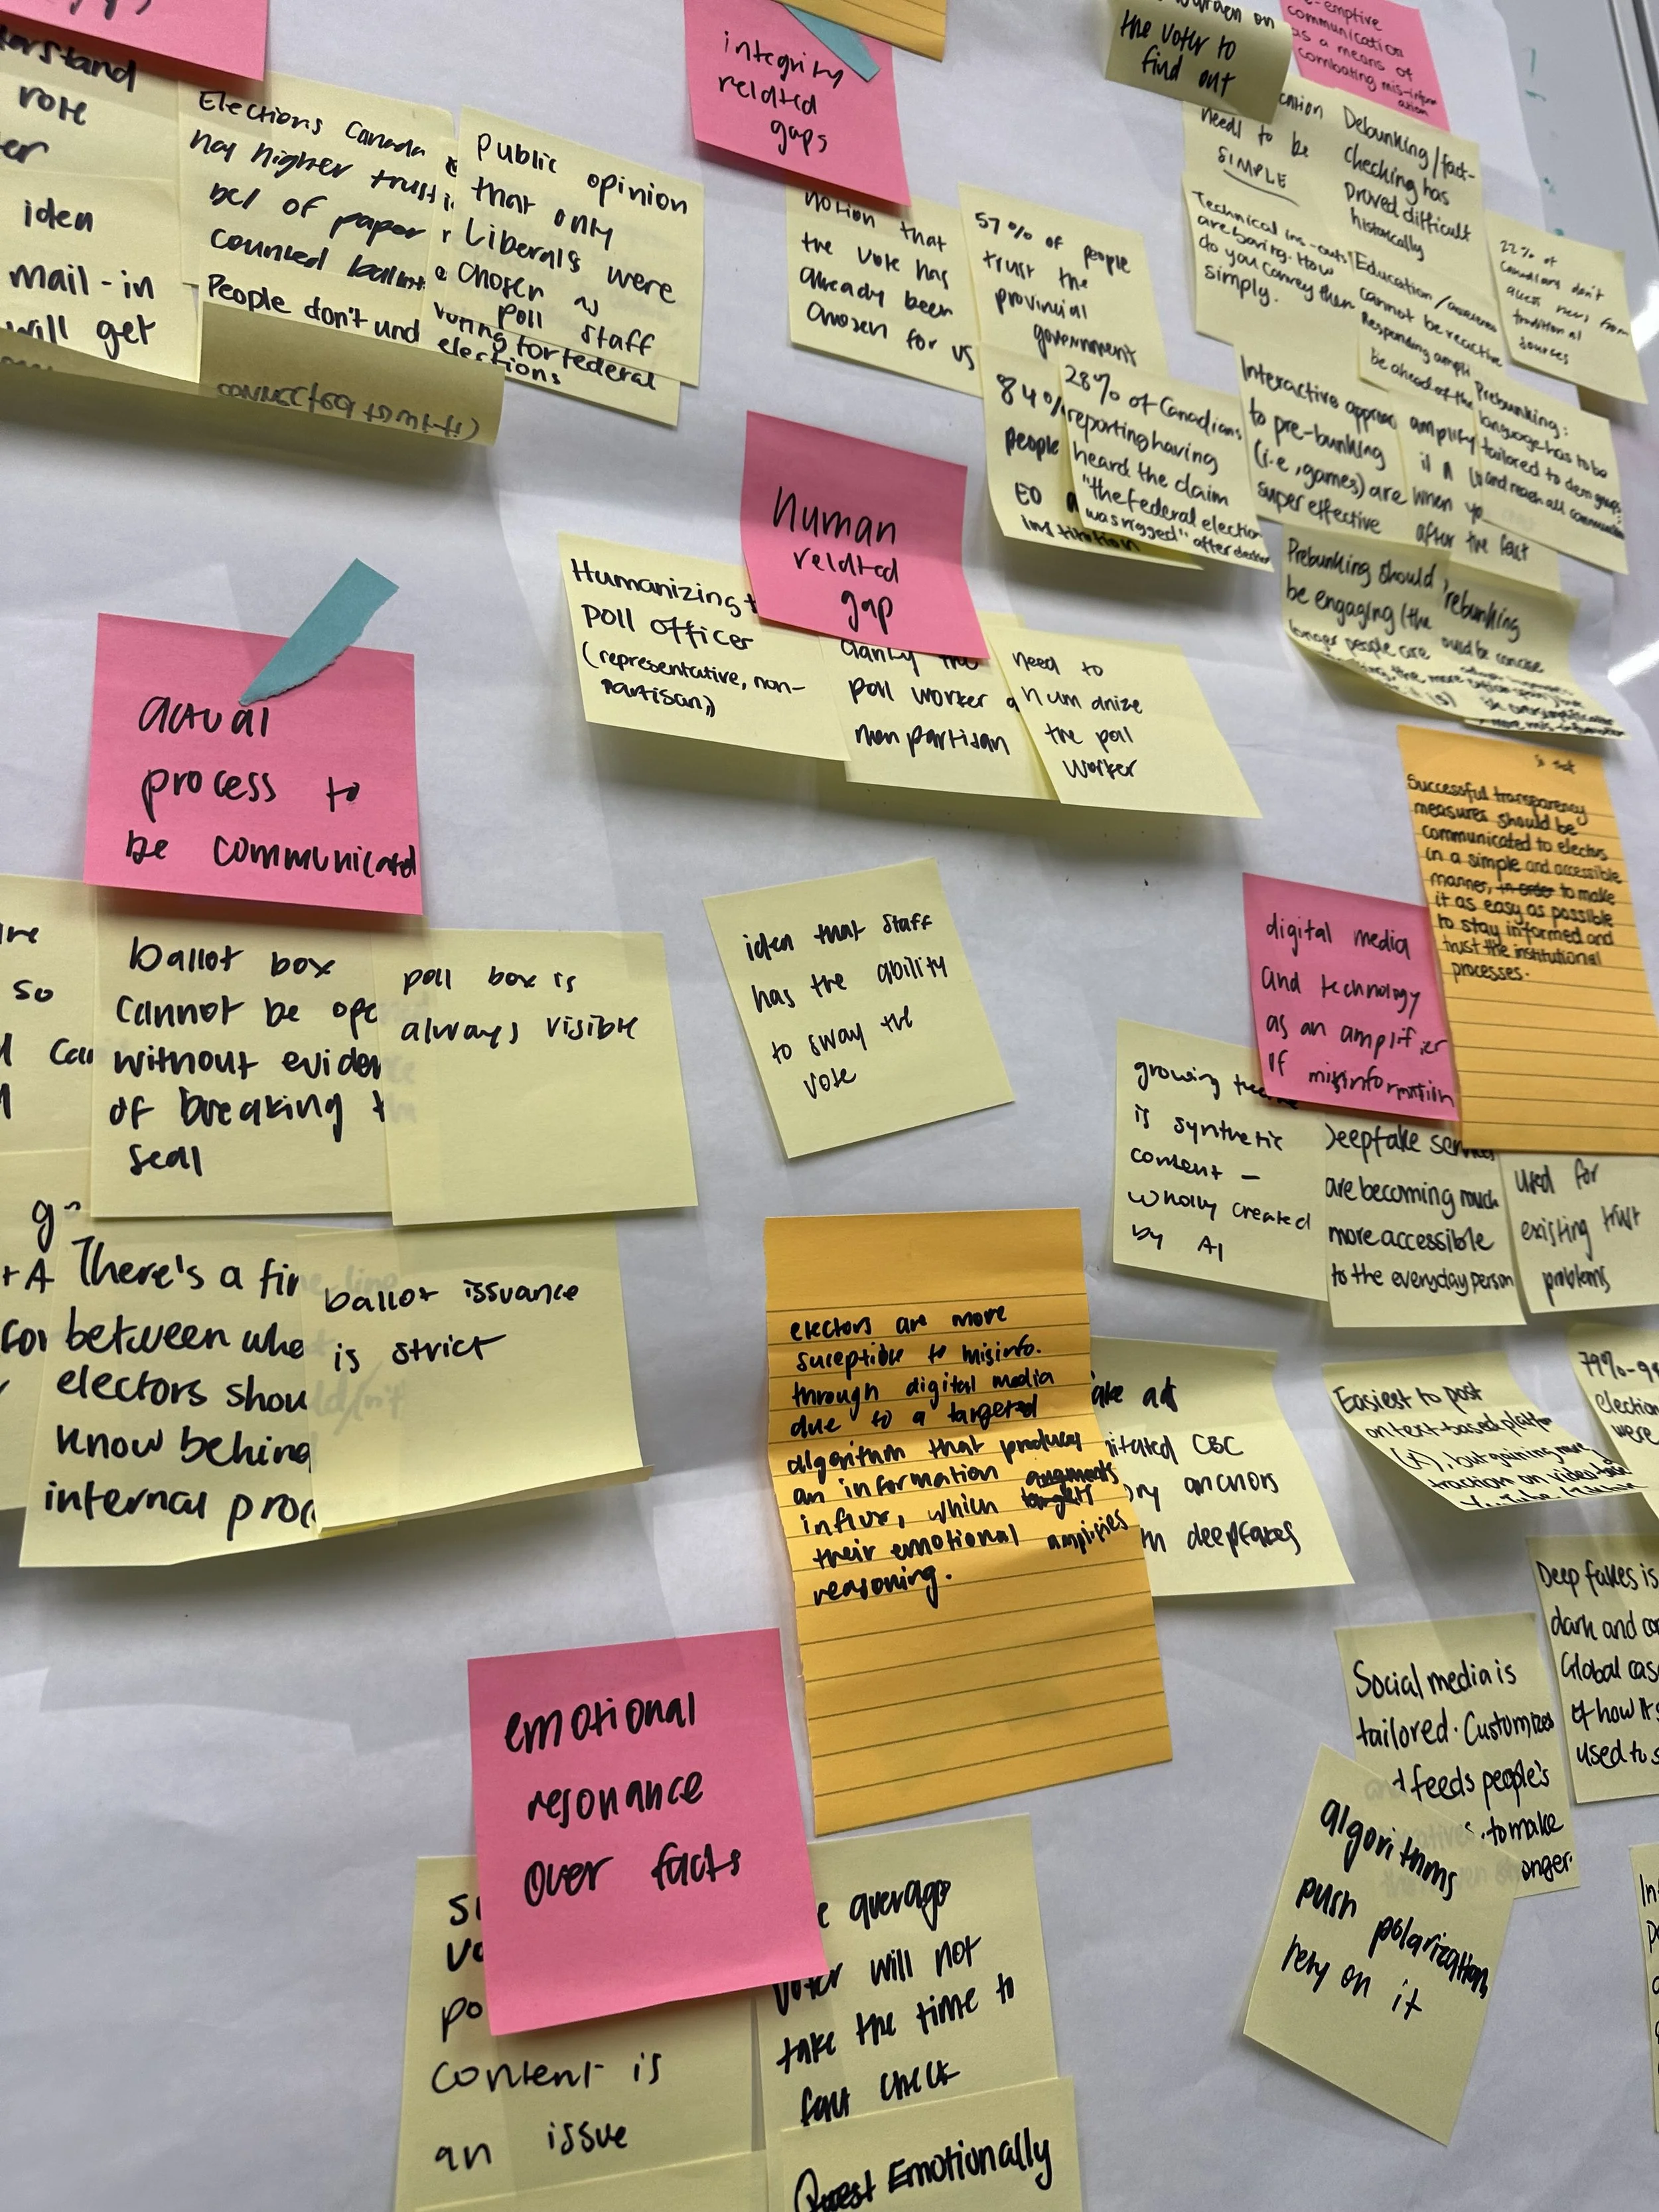
Mapping the user journey revealed that voters are most susceptible to false information in the periods right before voting, and right after. This was because there lacks a central voice of truth amidst social media noise. The task, then, became about making the voter feel aware and confident about electoral processes well before Election Day, and supported throughout their experience.
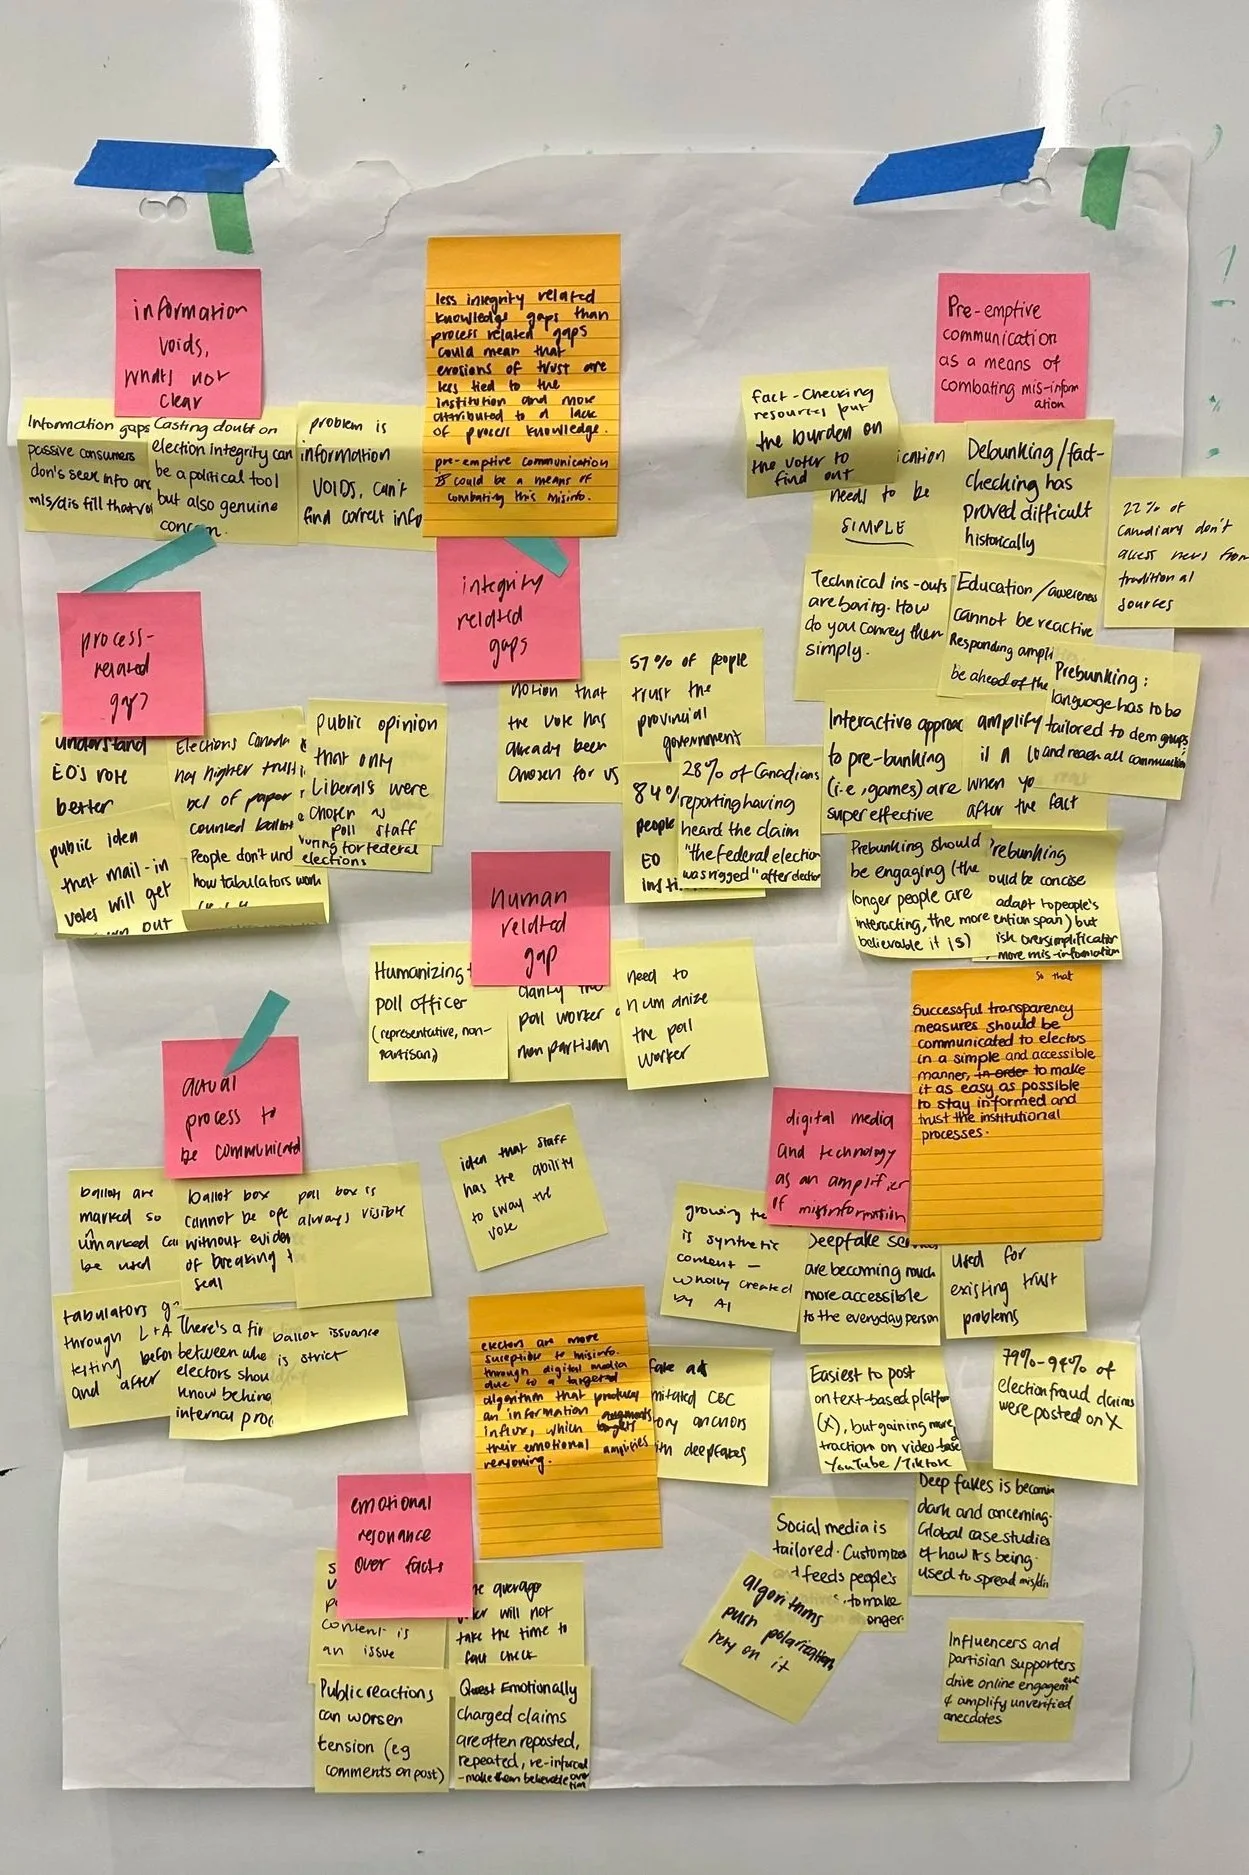
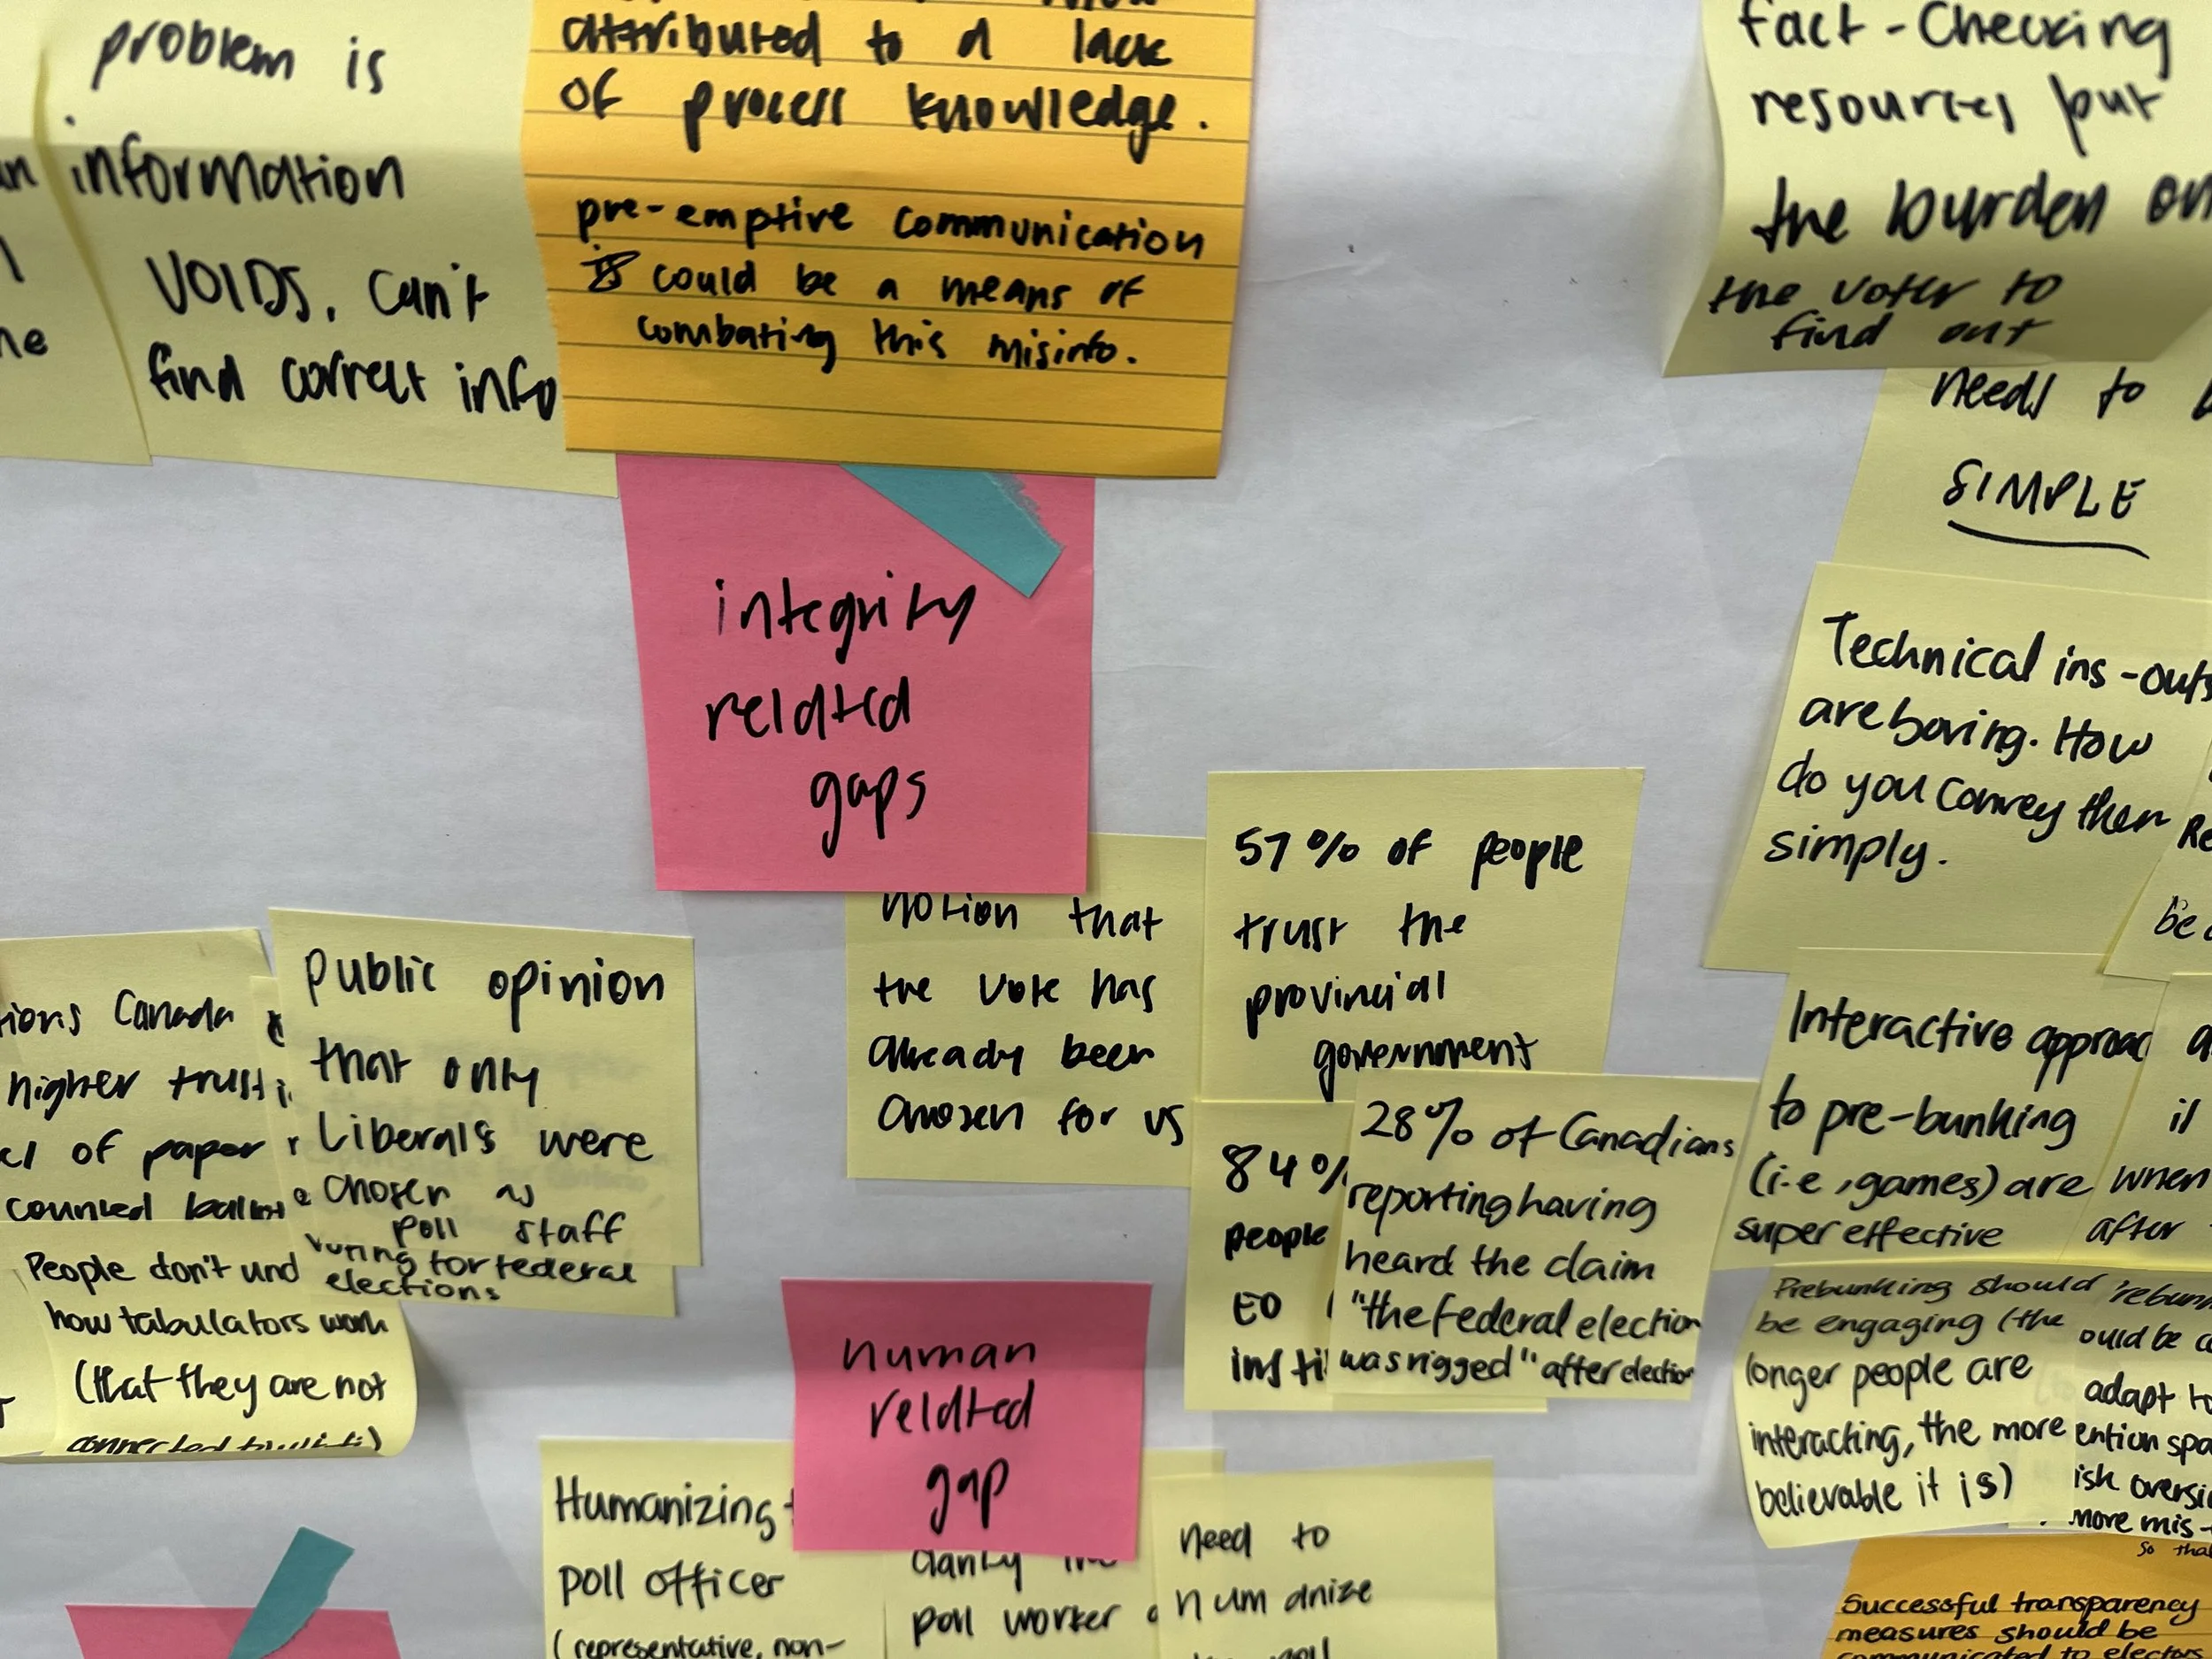
Affinity mapping of research insights.
THE IMPACT:
What emerged was a cyclical approach to combatting misinformation, in which the priority was monitoring real-time trends, developing simple, informative advertising campaign material that debunks myths, and meeting users where they are finding information. This emerged out of storyboarding of ideas surrounding pre-emptive awareness, exploring different methods of strengthening public knowledge through information and media, and then carefully evaluating and refining their feasibility.
The sprint concluded with two media-based prototypes, along with a set of recommendations on how Elections Ontario should approach public communication around misinformation, which we presented to EO Compliance Officers. The recommendation to monitor misinformation trends in real time resonated most, as it connected directly to their existing compliance work, and the recommendations as a whole were used to reinforce how they approach voter communication.
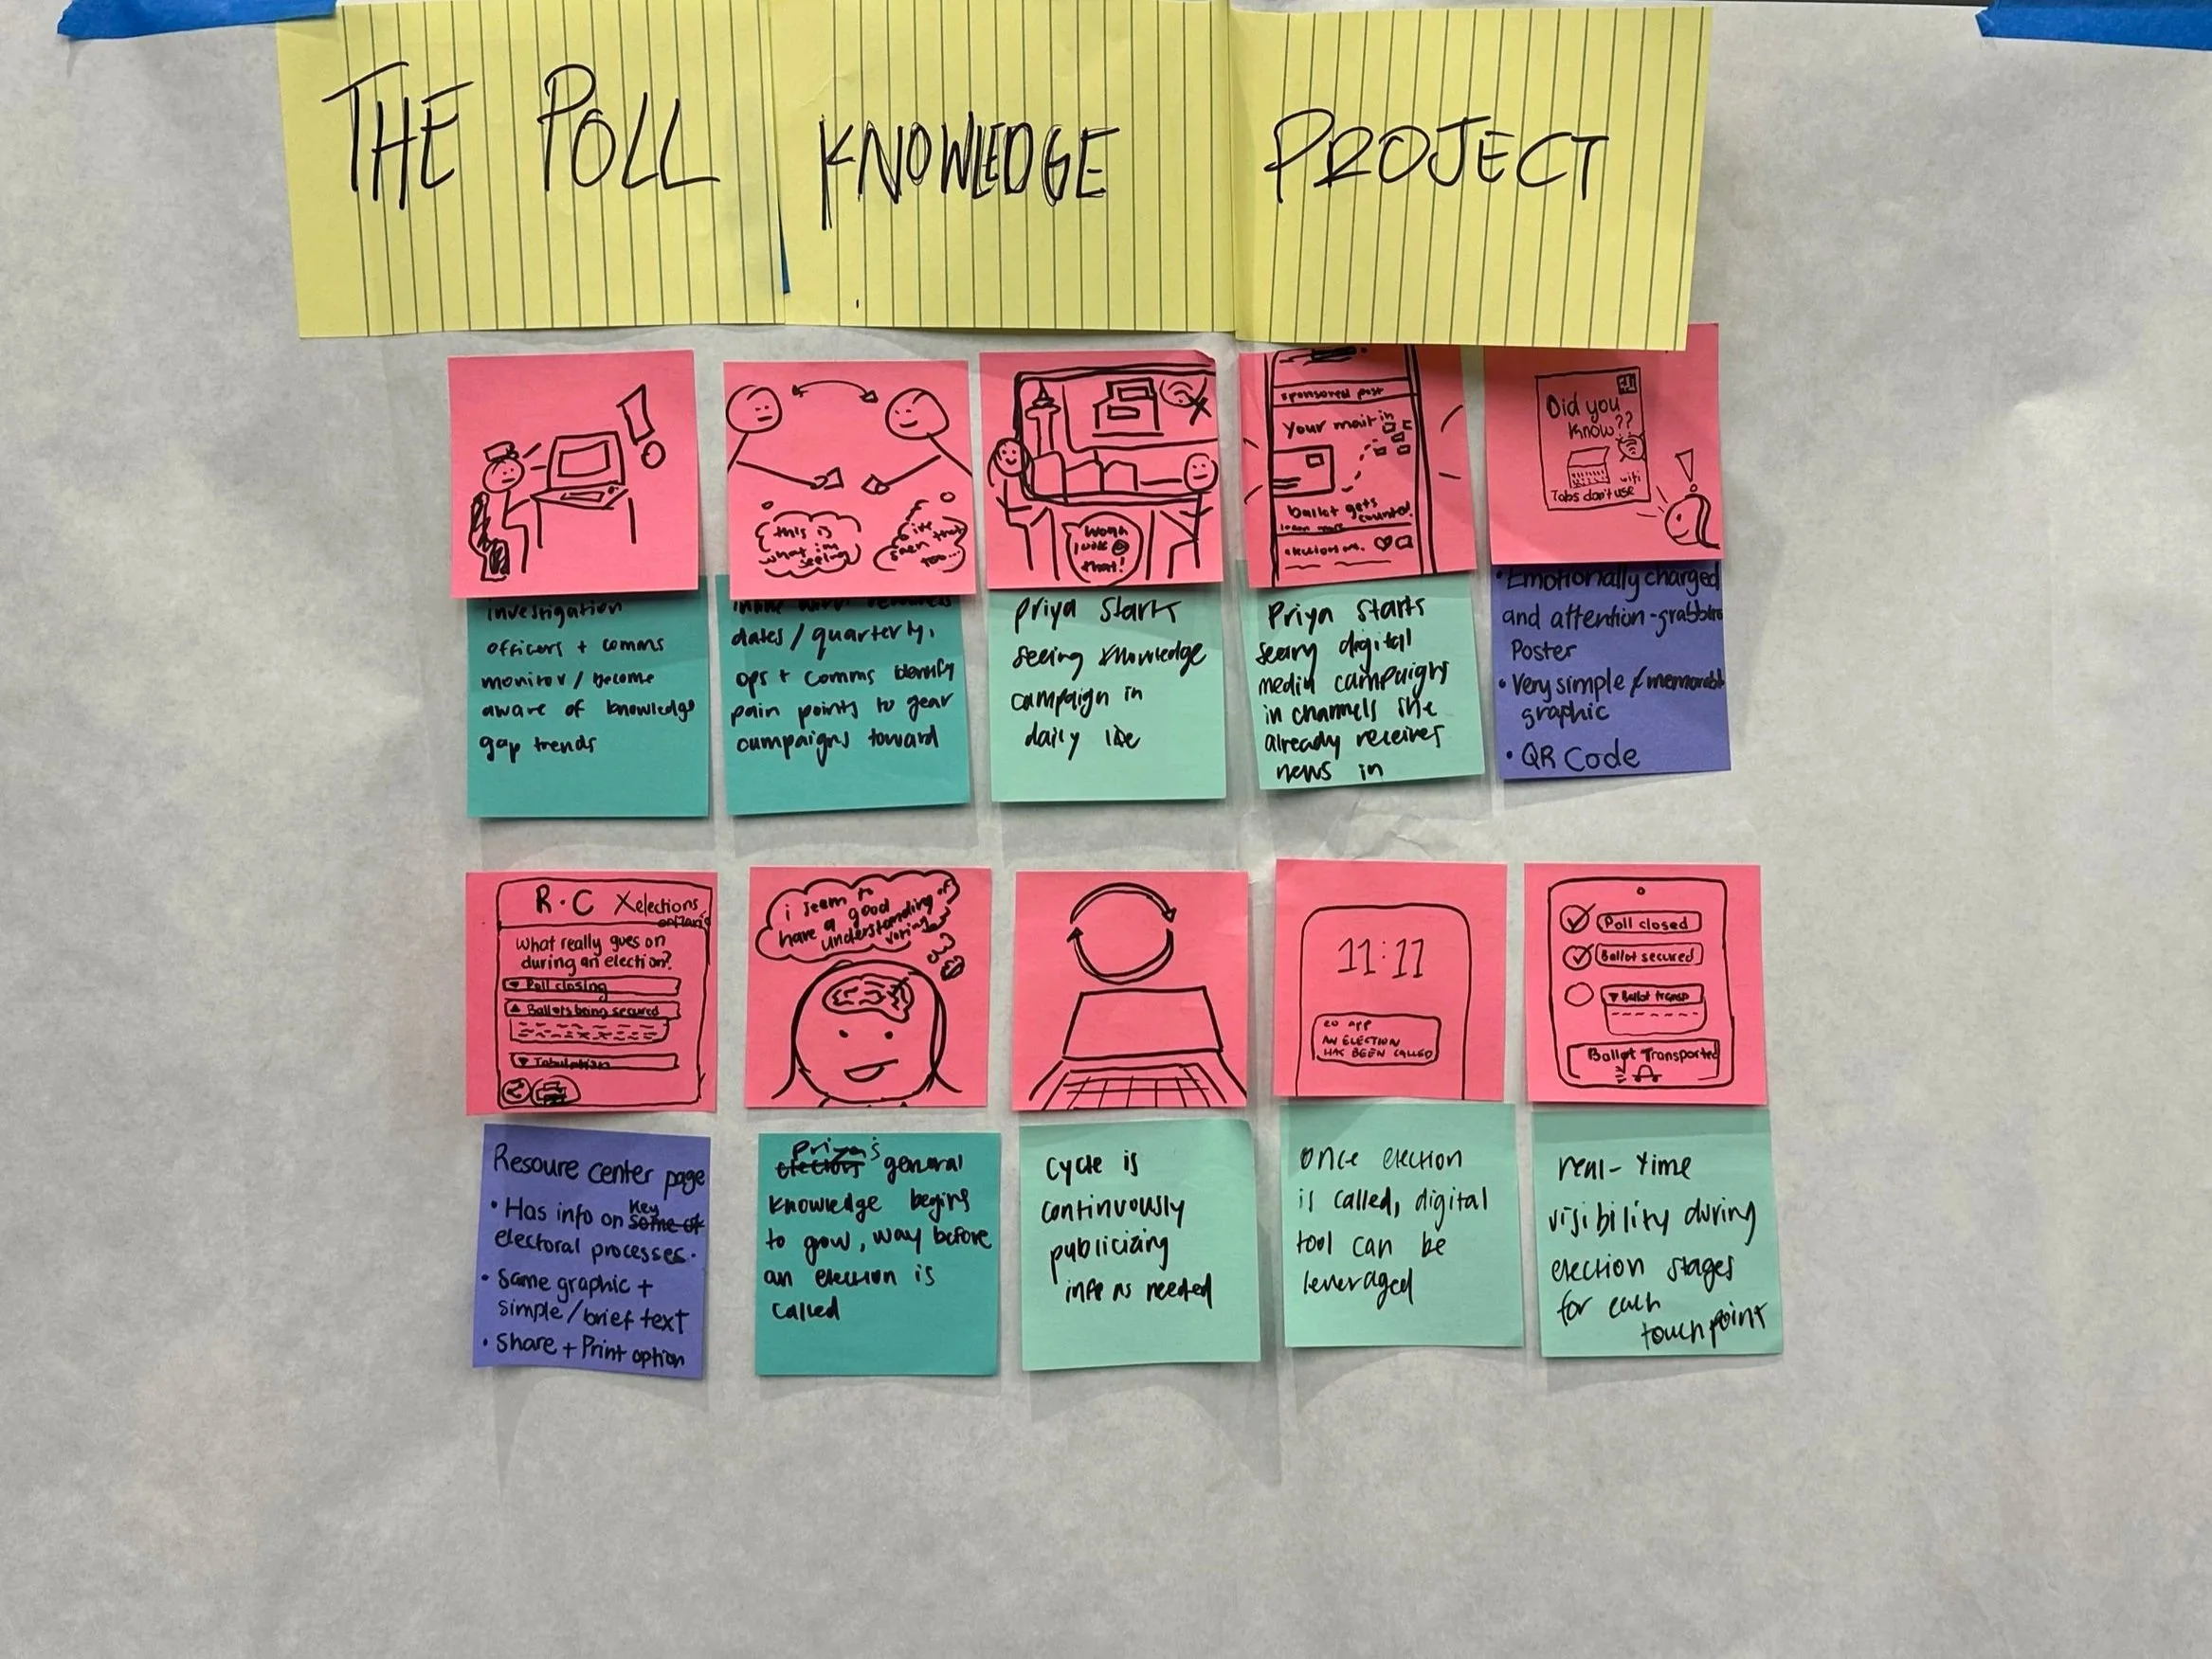
Storyboarding of final prototype.
This project allowed me to learn and immerse myself into Service Design research methods, and practice doing primary research for a real organizational concern. At times the process felt challenging, with little room to pause for reflection as the design sprint only lasted a week. Overall, the pace allowed me to learn and adapt to a government environment and build my foundations regarding many aspects of SD research and development.
With more time, I would have loved to explore how different narratives related to past trends of misinformation could be combatted through messaging, and how these media campaigns could link to a real-time tool walking electors through the voting process.
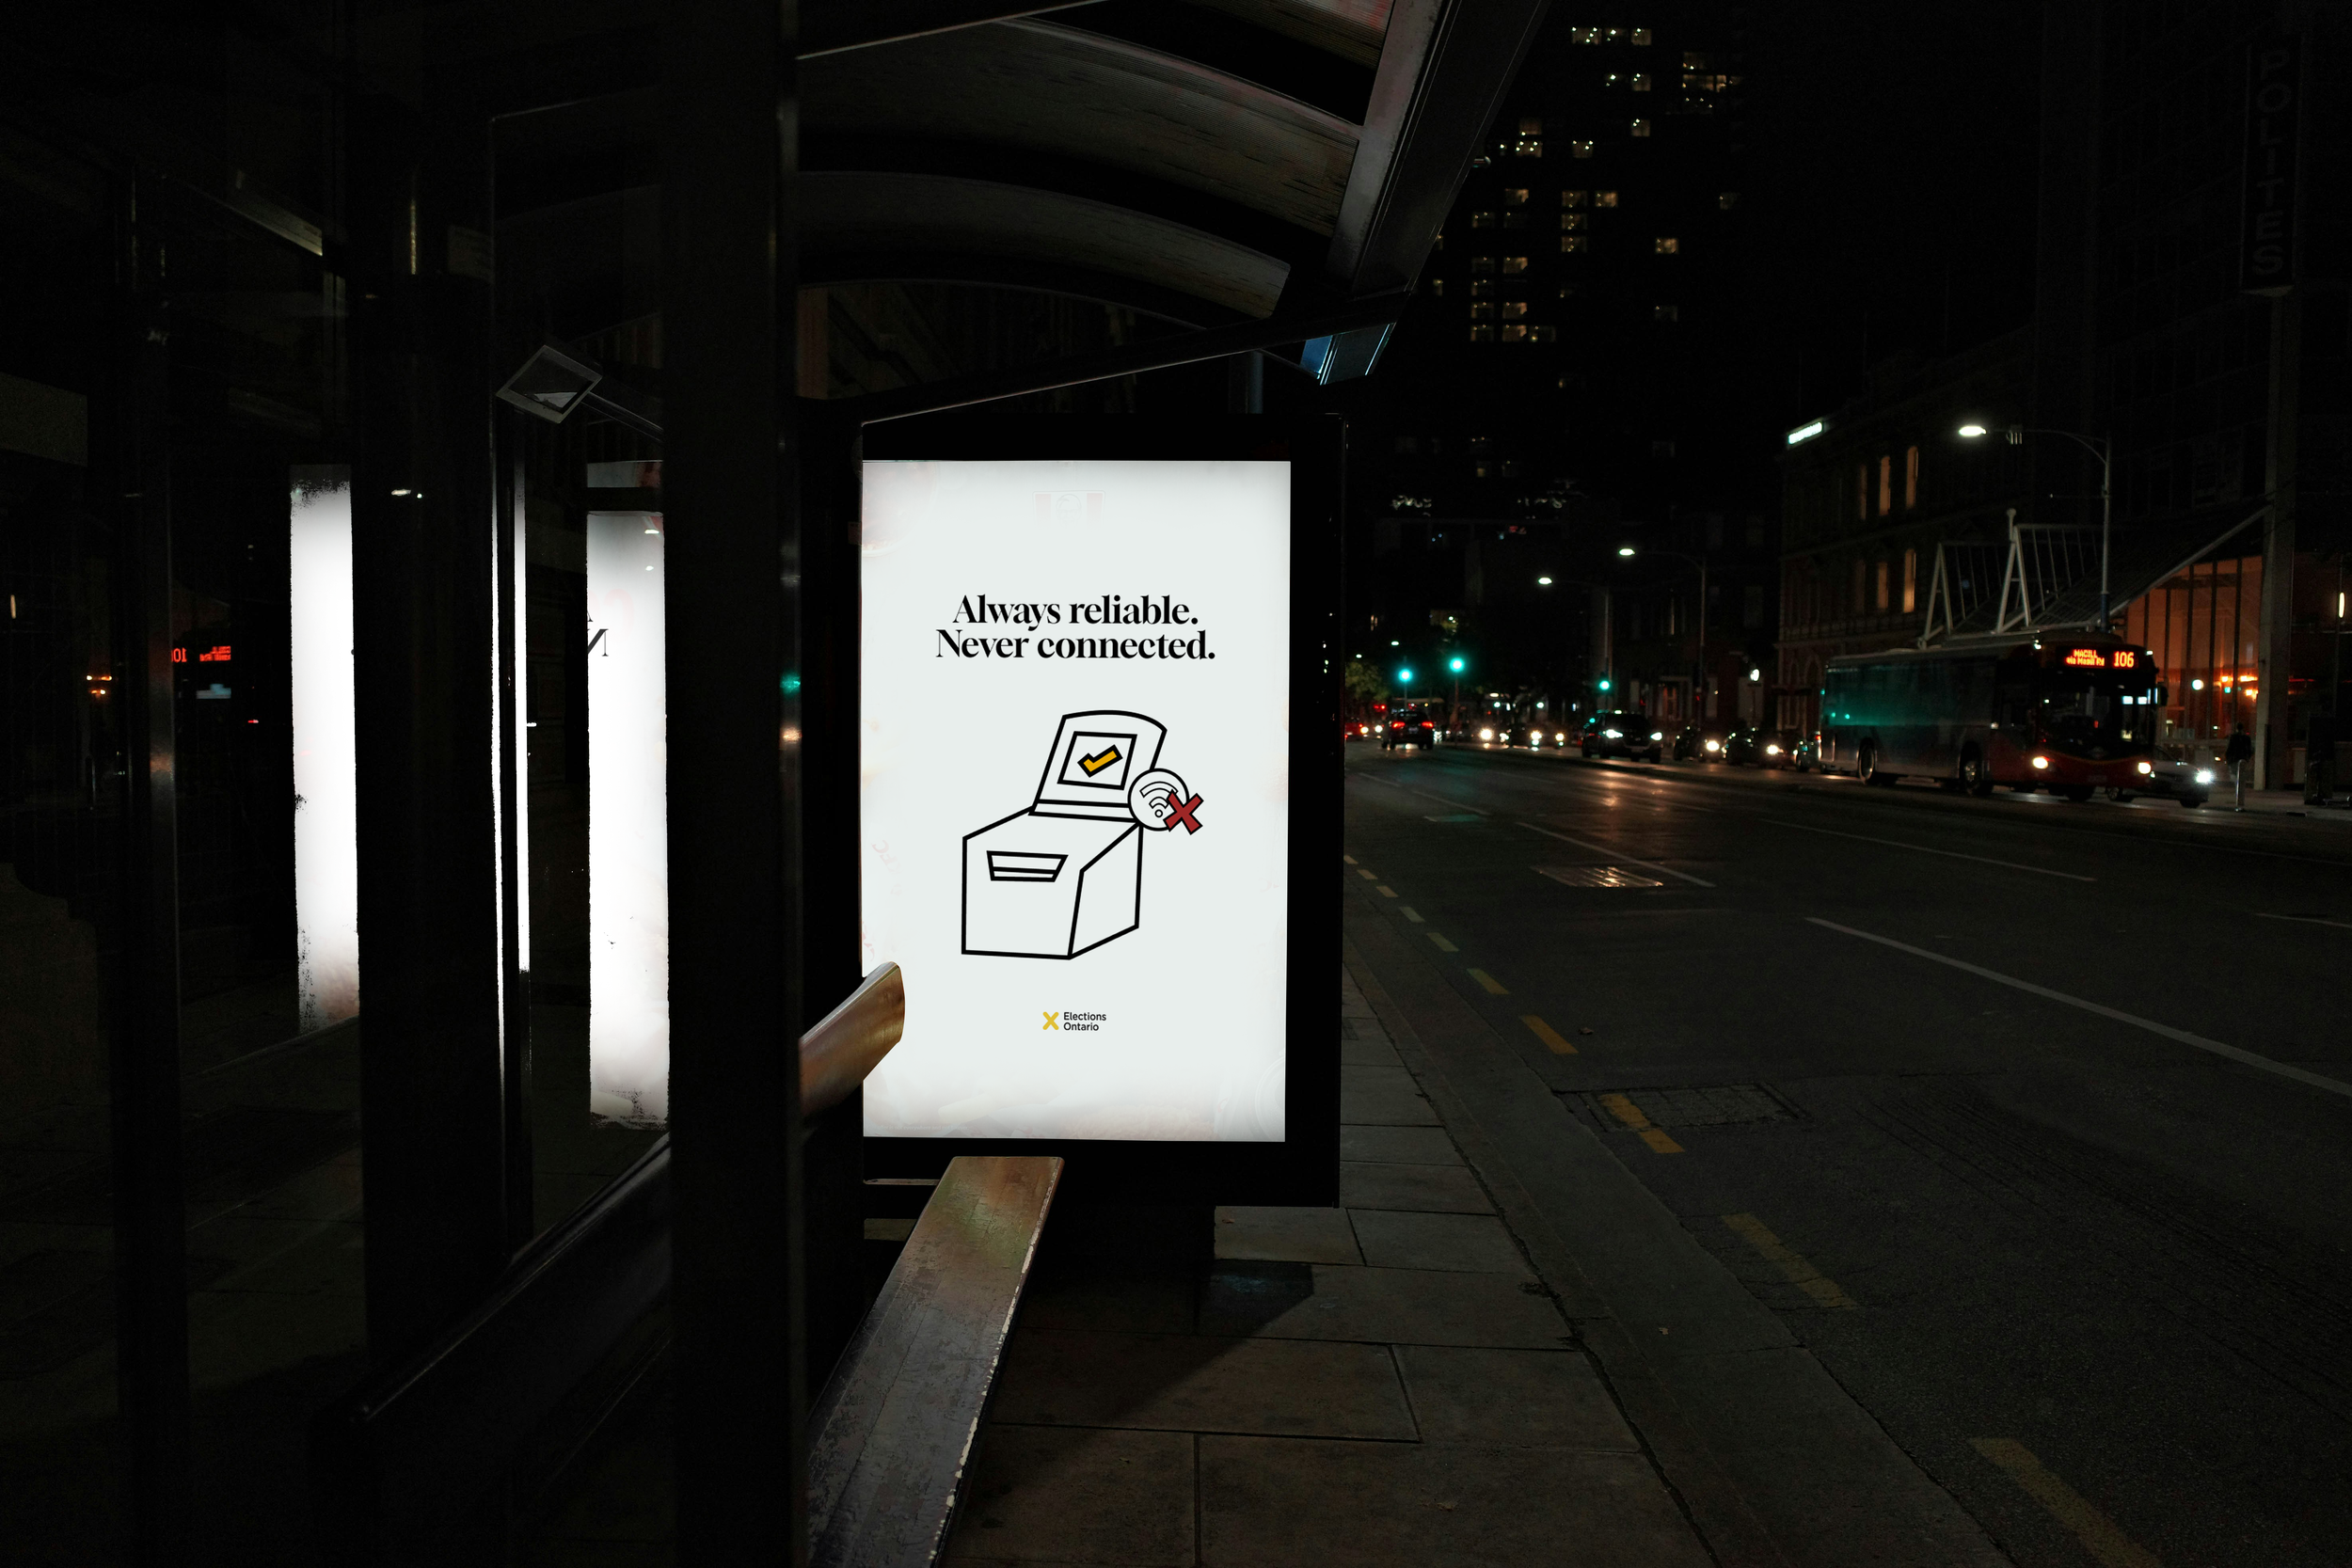
Future state versioning of our solution.